Build the Dashboard
In this section, you'll learn to:
- Connect to the tickets database.
- Fetch the ticket details from the database.
- Build a dashboard using the Chart and Stats Box widget.
- Display data from queries on the dashboard.
Connect the database
On the Entity Explorer to the left of the screen, click on the Dashboard page you created in the Setting up the application section.
In the Explorer tab, click the + icon next to Datasources to add a new datasource.
Select PostgreSQL under the Databases section. This opens the page where you can configure the fields to connect to a PostgreSQL database.
Click the pencil icon next to the default database name on the top left and rename the database to
supportTickets.Enter the following details in the connection parameter fields:
- Host Address:
mockdb.internal.appsmith.com - Port:
5432 - Database Name:
mockdb_v2 - Username:
postgres - Password:
plenty-cape-quality
- Host Address:
Click the Test button to test the connection and ensure the database is valid.
Click Save to create and save the database connection. You'll see the supportTickets database page.
Fetch ticket details
On the database page, click the + New Query button to the right of the screen.
Rename the query to
getTickets. Click the white space near the query templates.Write the following SQL query.
SELECT * FROM support_ticket;Click the Run button on the top right of the screen to execute the query and confirm that it returns data in the Response tab.
Click the Settings tab. Switch on the Run query on page load option.
Build the UI
Go back to the canvas by clicking on the Dashboard page on the Entity Explorer.
From under the Widgets tab, drag and drop two Text widgets on the canvas.
To set the title using the first Text widget, on the Property Pane to the right of the screen, enter
Dashboardin the Text property.Click the Style tab on the Property Pane. Select XL in the Font size property list.
For the personalised greeting in the second Text widget, enter the following in the Text property:
👋 Hey {{appsmith.user.name}}, welcome back!For more information about the
appsmith.userobject, see Context Object.The output should look like this:

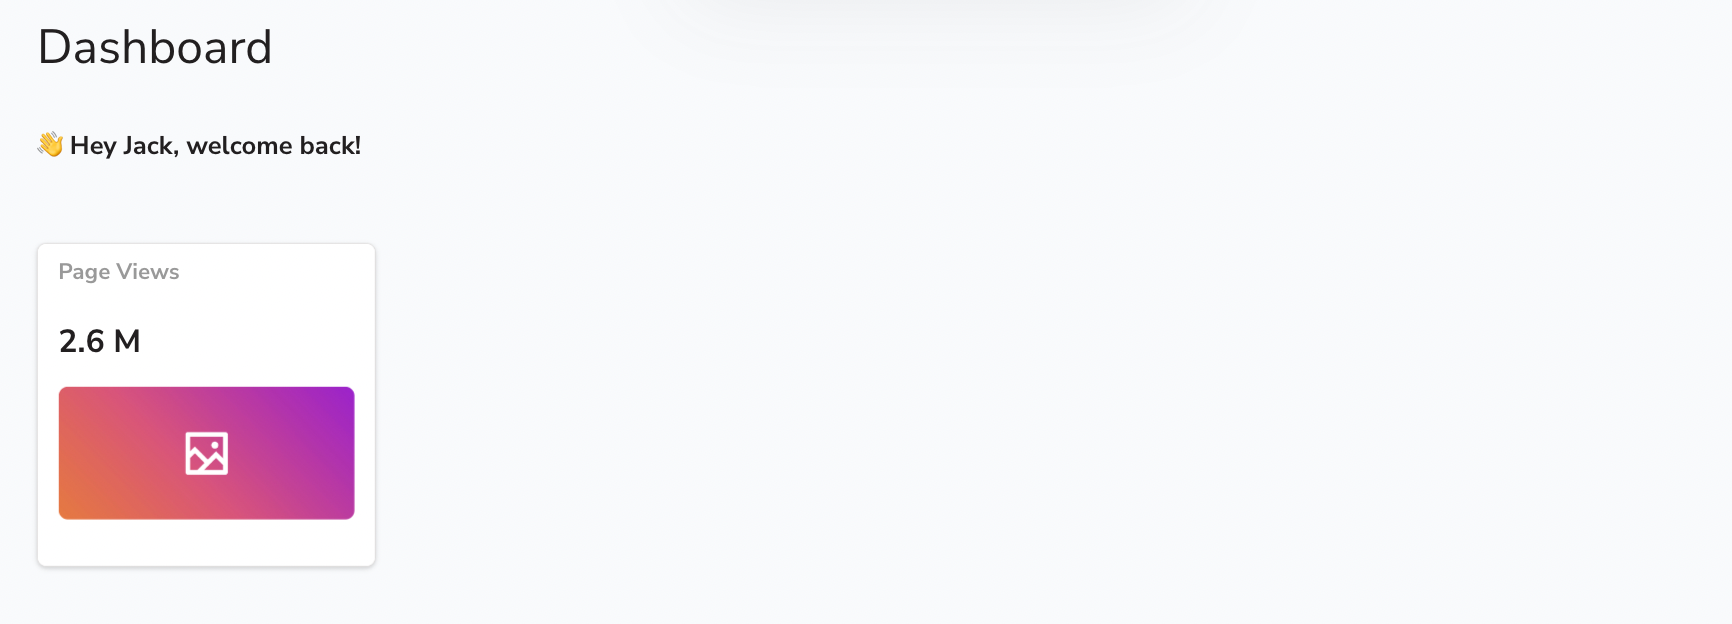
- Drop a Stats Box widget on the canvas. Delete the default Icon Button and the Text widget with the value 21% more than last month. Add an Image widget below the Text widget with the value 2.6 M. The output should look like this:

Set the following values for the components in the Stat Box widget:
- In the Text widget with the default value Page Views, set the value in the Text property to
Unassigned. - In the Text widget with the default value 2.6 M:
- Set the value in the Text property using JS code to filter all the tickets that have no agents assigned to them.
{{getTickets.data.filter(t => t.assigned_to==null).length}}- Click the Style tab on the Property Pane. Select XL in the Font size property.
- Select the Image widget.
- In the Image property, enter the below URL:
https://cdn-icons-png.flaticon.com/512/1077/1077012.png- In the Object fit property, select Contain from the list of options.
- Select the Stats widget. Click the Style tab. In the Background color property, select the lightest shade of green color
#f0fdf4from the palette.
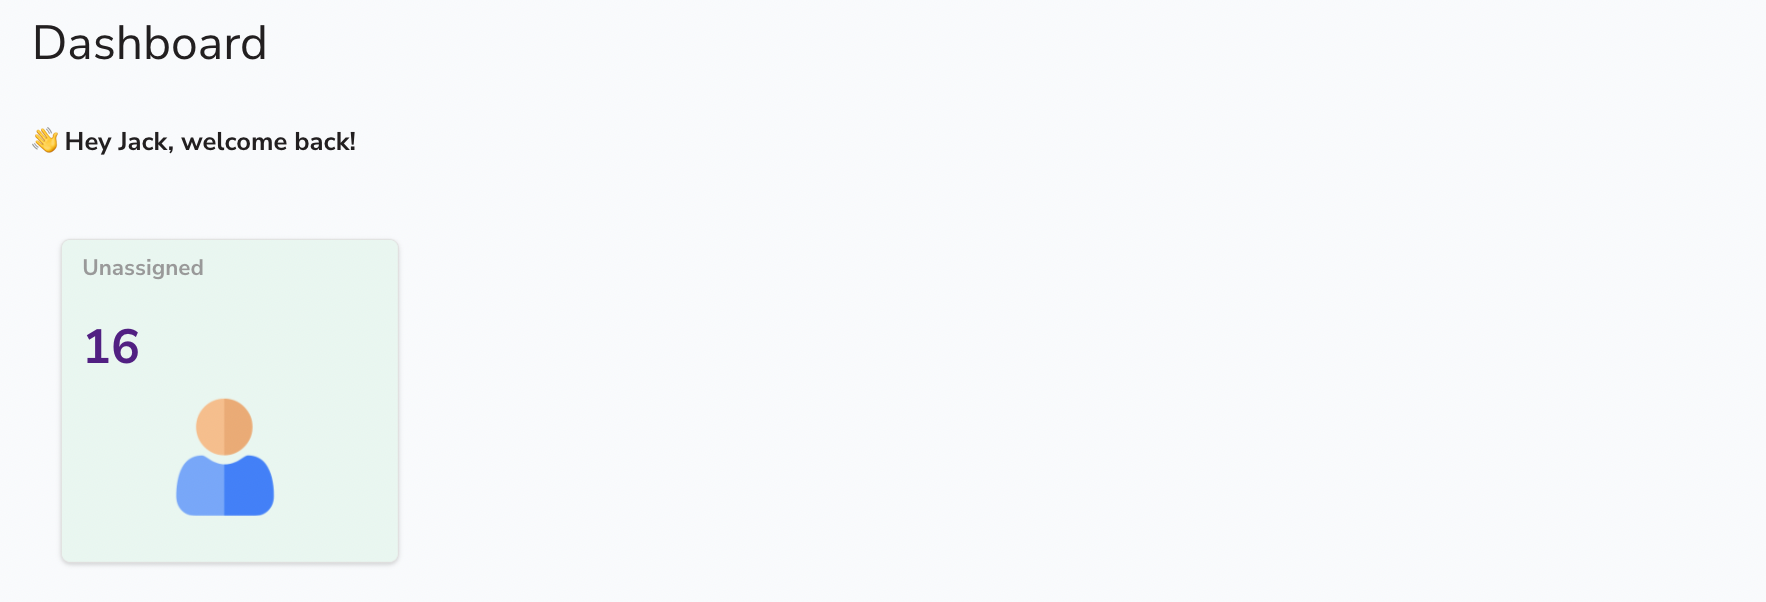
The output should look something like this:
- In the Text widget with the default value Page Views, set the value in the Text property to

Select the Stats Box widget and duplicate using
CMD+C(Mac) orCtrl+C(Windows) and paste three copies next to each other, as shown in Fig 4.Repeat step 7 for each Stats Box widget. Refer to the table below for property configuration:
Open ticket stats
| Property | Value |
|---|---|
| Text | Open |
| Text | {{getTickets.data.filter(t => t.status==='open').length}} |
| Image | https://cdn-icons-png.flaticon.com/512/833/833643.png |
| Background color | #eff6ff |
Critical ticket stats
| Property | Value |
|---|---|
| Text | Critical |
| Text | {{getTickets.data.filter(t => t.priority==='high' && t.status==='open').length}} |
| Image | https://cdn-icons-png.flaticon.com/512/2797/2797387.png |
| Background color | #fef2f2 |
Overdue ticket stats
| Property | Value |
|---|---|
| Text | Overdue |
| Text | {{getTickets.data.filter(t => t.status==='open' && moment(t.created_at).diff(moment(),'days') <= -30).length}} |
| Image | https://cdn-icons-png.flaticon.com/512/10755/10755684.png |
| Background color | #fefce8 |
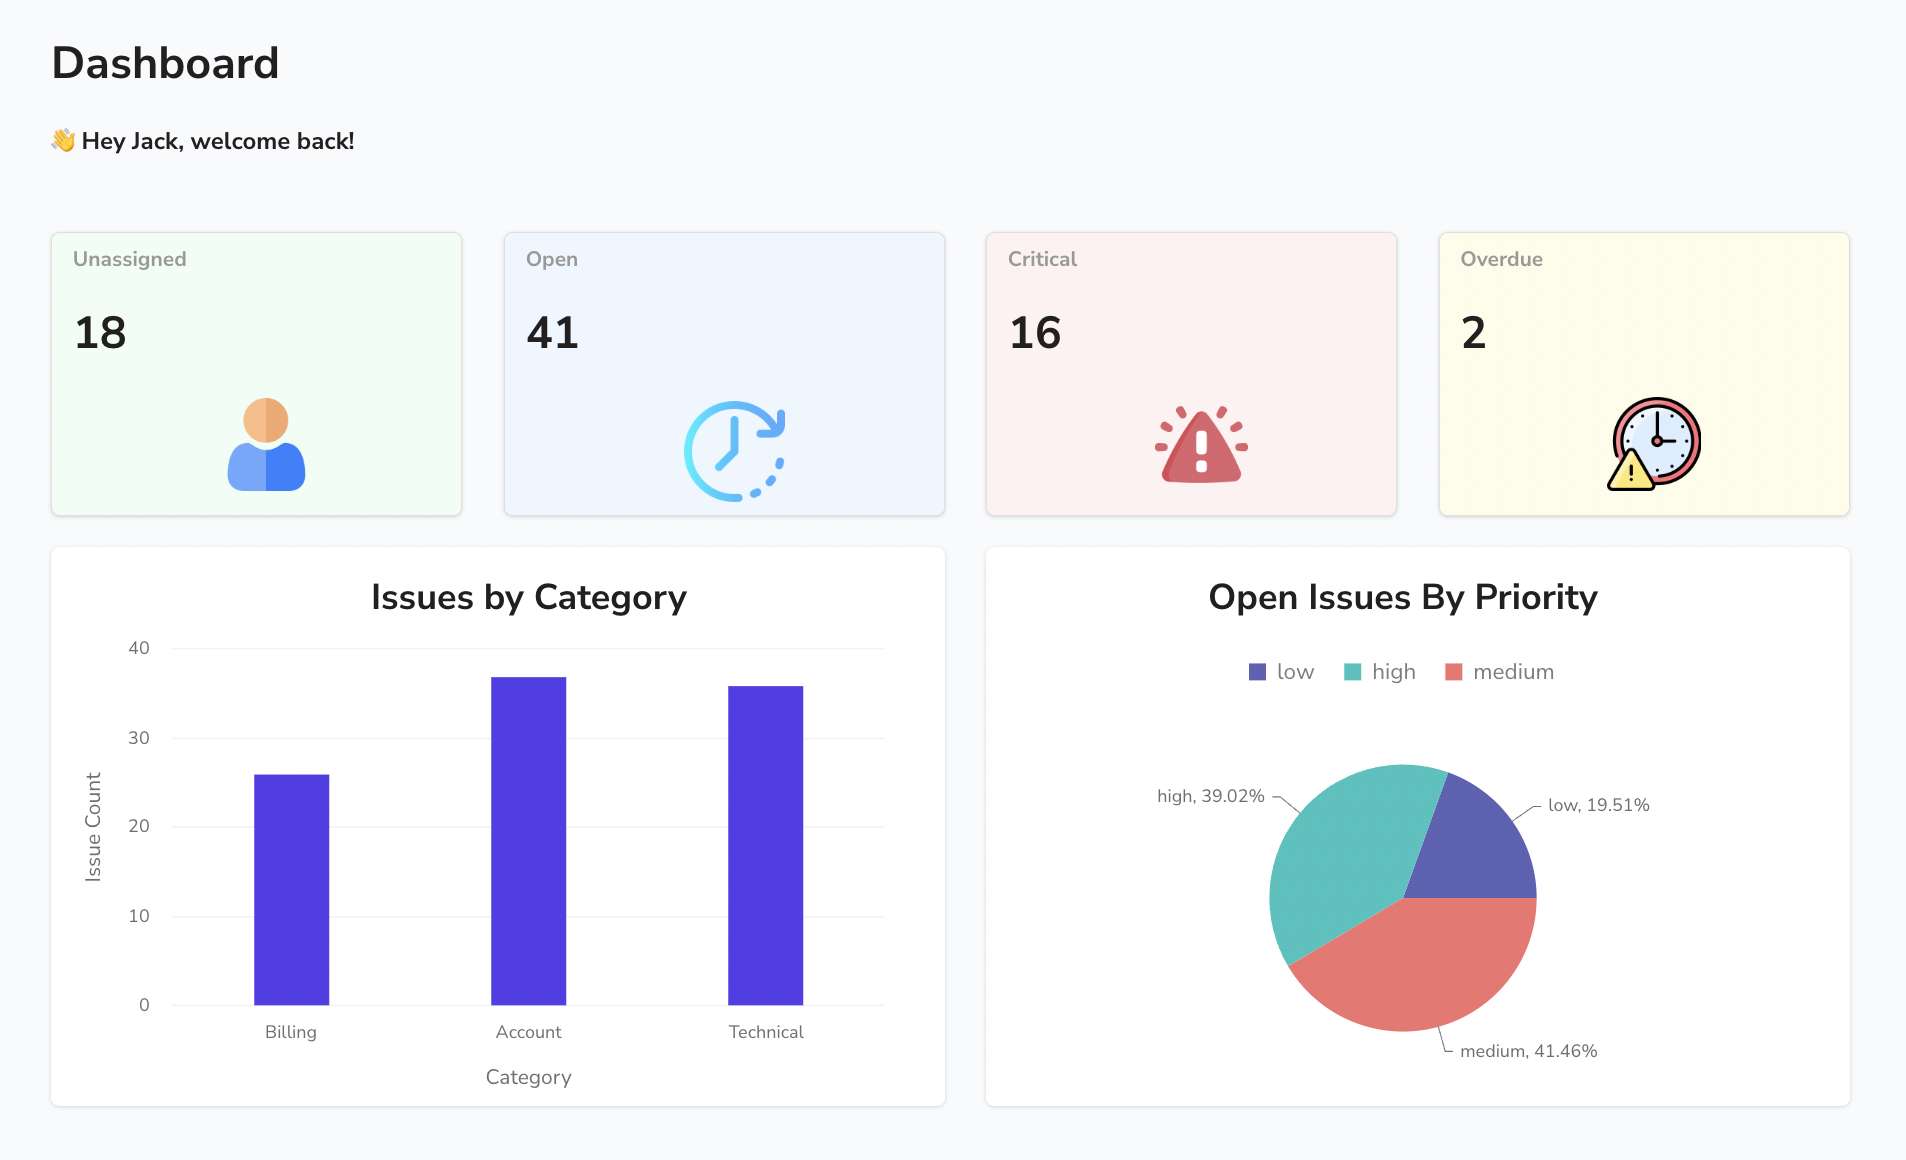
The output should look something like this:

Fetch data for charts
Select the Explorer tab on the Entity Explorer to the screen's left.
Click the + icon next to Queries/JS.
Select supportTickets query from the list of options.
Rename the query to
issuesByCategory. Click the white space near the query templates.Paste the below SQL command in the query editor to fetch issues for each category. The Chart widget expects data in the structure
{ x: string, y: number }.SELECT category as x, COUNT (*) AS y FROM support_ticket GROUP BY category;Click the Run button on the top right of the screen to execute the query and confirm that it returns data in the Response tab.
Click the Settings tab on the query editor. Switch on the Run query on page load option.
Repeat steps 2 to 4 to create another query named
openIssuesByPrioritywith the following SQL command to fetch the status and priority of open tickets.SELECT status, priority as x, COUNT(*) as y from support_ticket WHERE status = 'open' GROUP BY priority,status ORDER BY y;Go back to the canvas by clicking on the Dashboard page on the Entity Explorer.
Create column and pie chart
Drop a Chart widget below the Stats Box widget. By default, the Column Chart option is selected in the Chart type property. Set the other properties as shown below:
- In the Series title property, change the default title from Sales to
Issues. - In the Series data property, bind the query result by setting the value to
{{issuesByCategory.data}}. - In the Title property, enter the value
Issues by Category. - Under the Axis section, in the x-axis label property box, enter
Category. In the y-axis label property, enterIssue Count.
- In the Series title property, change the default title from Sales to
Drop another Chart widget to the right of the column chart. Set the properties as shown below:
- Select the Pie Chart option in the Chart type property.
- In the Series title property, change the default title from Sales to
Issues. - In the Series data property, bind the query results by entering the value
{{openIssuesByPriority.data}} - In the Title property, enter the value
Open Issues By Priority.
The output should look something like this:

